I have cochlear hydrops in my left ear. Since October 2025 I've recorded over 250 audiograms, mostly on AirPods, some in a clinic booth, along with symptom logs, medications, flights and every run I've done.
That's a lot of data. And until last week, the only way to use it was to look at it.
A chart is good at showing you a shape. It is bad at answering a question. "How much has 500 Hz moved since May?" means squinting at a line. "What was happening the last three times my thresholds dropped like this?" means scrolling back through months of entries and holding it all in your head.
Most of the time you don't bother, and the answer stays in the data unread.
So I built a connector that lets Claude read my EbbChart record directly. It means I can ask questions about my hearing history in a normal conversation, with Claude working from the actual measurements and logs I've collected.
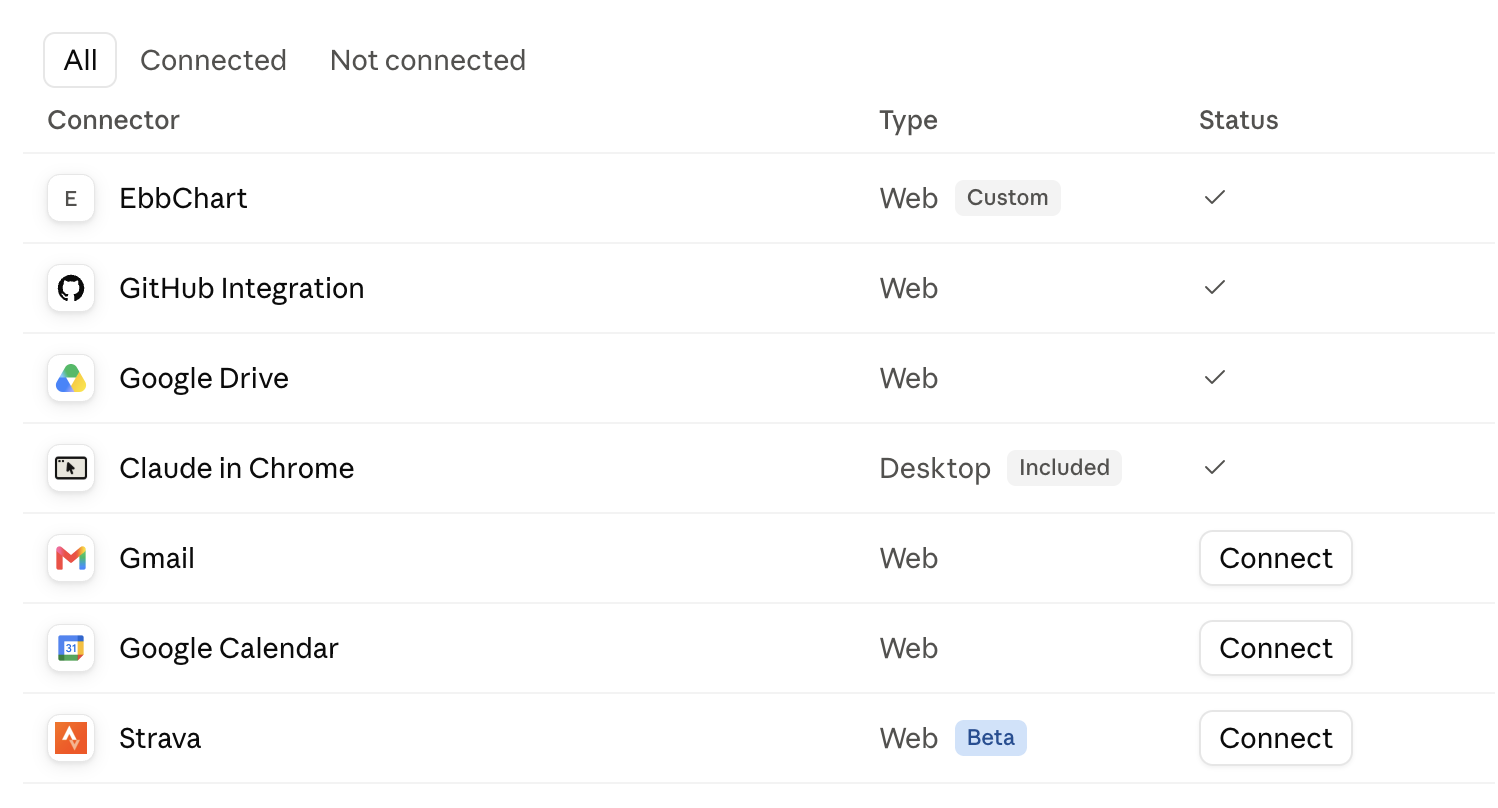
It uses an open standard called MCP - the Model Context Protocol - a common way for an AI assistant to read data from an app you use, with your permission. If you've given EbbChart access to Apple Health, it's the same idea pointed in a different direction.
What it's actually like
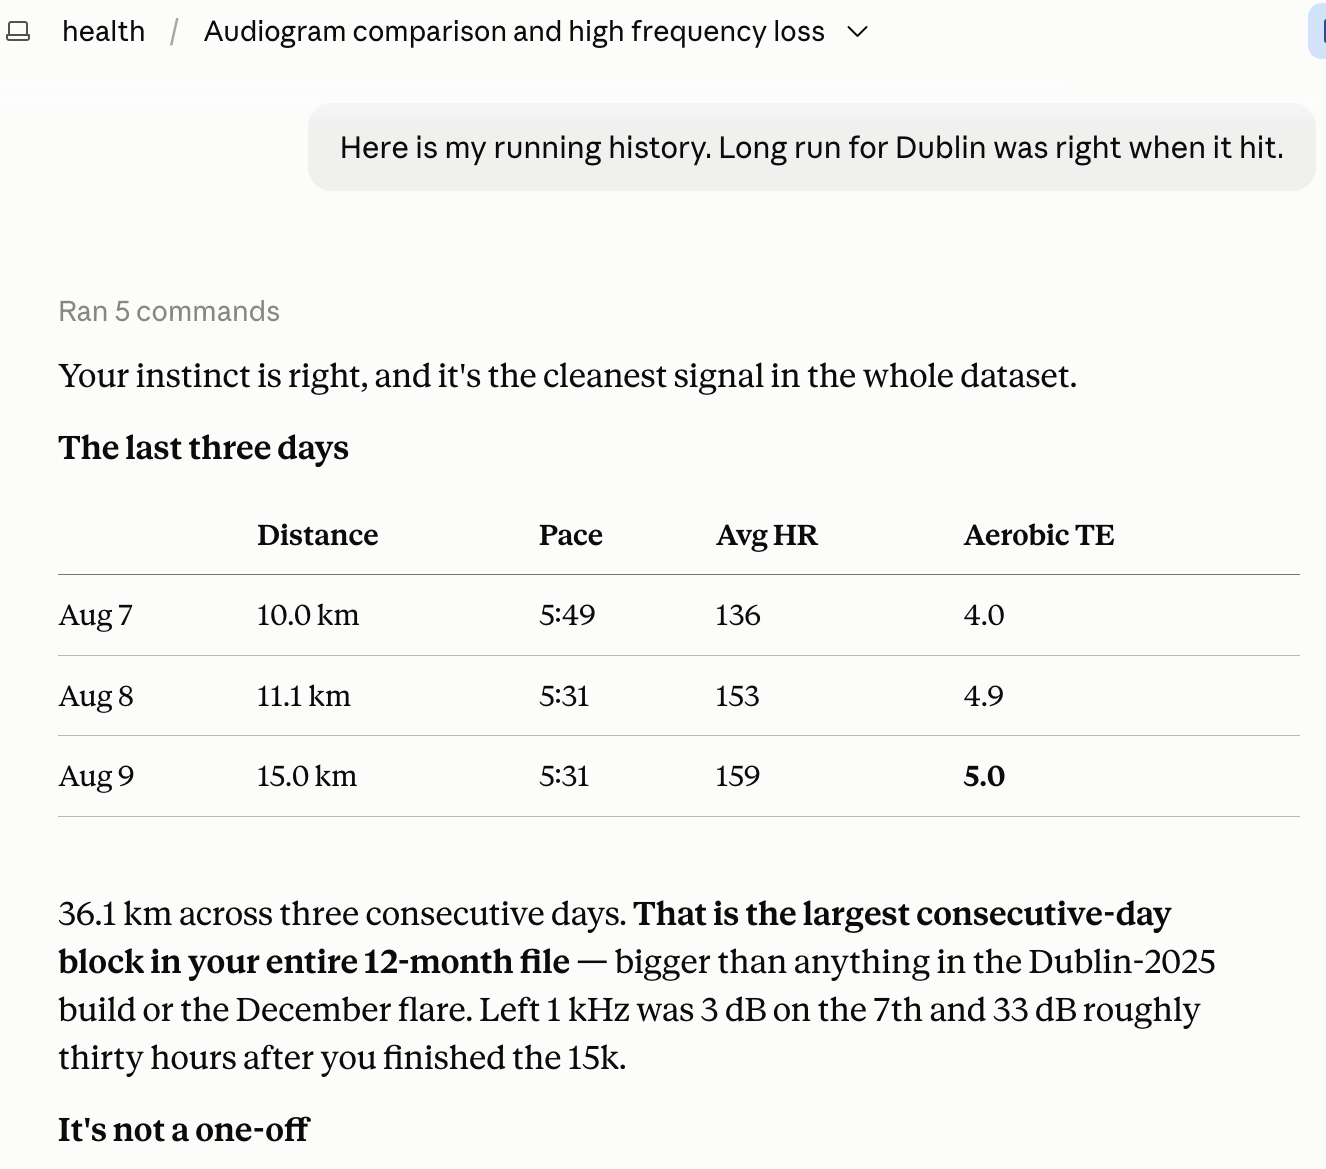
Last week my hearing at 1 kHz dropped from 3dB to 36dB over three days. That frequency matters to me because I've seen significant changes there before. The last time it moved like that was December, during what ended up being the worst deterioration in my record.
It came back - 17 dB the next day, and into single figures by the end of the week. That recovery is itself part of why the longitudinal record matters: a single reading on a bad afternoon looks like a catastrophe, and the week around it tells you something quite different.
I'd also done my biggest three days of running in a year immediately beforehand.
I had already started to form a theory about what was happening.
So I asked Claude to test it.
Importantly, I didn't ask "is running bad for my hearing?" I asked it to define what counted as a deterioration using my own trailing baseline, before looking at any of the possible causes, and then check what tended to happen beforehand.
The answer was not what I expected.
Hard training sessions preceded three of the six deteriorations. But I run every two or three days, so hard sessions happen frequently enough in my data that the association was much weaker than the story I'd been telling myself.
What did show up before all six was a rise in my resting heart rate, including two episodes with no hard training anywhere near them. One of those was a week I'd logged as "feeling unwell".
Here's the awkward part: EbbChart doesn't hold that data.
My resting heart rate lives in my watch. I had to export ten months of it by hand, as a pile of JSON, and analyse it separately. The connector could see my audiograms and symptom logs, but it couldn't see the variable that turned out to be most interesting.
I had a story about running. The data suggested a different question: whether what I was seeing was related more broadly to systemic strain, of which hard training might be one cause and being ill another.
I'd have carried the running theory into my next appointment.
I want to be careful here. Six events is not a study. This is one person's descriptive analysis of his own noisy home measurements, and it proves nothing about anyone else or, honestly, very much about me.
But it's a better question to bring to a specialist than the one I had before.
And that's the point.
What I decided it should not do
Building this meant making some choices about a connector that reads health data.
First, it's read-only. There are four tools: hearing tests, symptom logs, medication courses and profile. None of them can create, change or delete anything.
Second, it's off by default. You have to enable it inside EbbChart, where the app explains what data can leave EbbChart, who receives it and that it can include information originally imported from Apple Health. You can turn it off again in one tap.
Third, the data carries its own warning label. Every response explains that these are patient-collected measurements with known test-retest variability and that tests may have been performed on different hardware. A 5 dB movement in a home hearing test is not automatically a finding just because a model can see it.
And EbbChart itself doesn't try to infer anything from the data before handing it over. It doesn't rank causes or decide what's important. The analysis happens in the conversation, where you can question the conclusions and push back on them.
I did. More than once.
What it doesn't do
It doesn't diagnose anything. It doesn't tell you what to do.
EbbChart is a personal tracking tool, not a medical device, and it hasn't been clinically validated. Home audiometry is not the same as testing in a booth, and the connector says so on every response.
And AI can be confidently wrong.
During my own session Claude stated a probability with more certainty than six events could possibly support. I pushed back and it revised its answer.
Treat this as a way of interrogating your data, not a source of conclusions.
Why this matters for a fluctuating condition
If your hearing is stable, an occasional audiogram may be a reasonable record of it.
If it fluctuates, things are different.
The clinic visit captures one moment. What happened in the weeks and months between visits can disappear, which is why I built EbbChart in the first place.
But preserving the record was only half of the problem.
Hundreds of audiograms that nobody can question are ultimately just a better documented gap. Being able to ask what changed, when it changed, what else was happening at the time and whether the same pattern has happened before makes the record much more useful.
I went through my 1 kHz chart with my consultant last week. The preparation I'd done beforehand with Claude helped in that conversation.
But using the connector also exposed something I hadn't really considered when I built it.
The most interesting signal in this particular analysis wasn't in the hearing data at all.
It was in my resting heart rate.
EbbChart already imports audiograms from Apple Health. Resting heart rate and sleep are there too. If the aim is to understand what was happening around a change in hearing, that wider context may turn out to be important.
I'm looking at adding it.
I'm deliberately not saying that elevated resting heart rate affects hearing, or even that it explains what happened to me. One person with six events is not a reason to build a conclusion around anything.
It is a reason to ask better questions.
Trying it
The EbbChart connector works with Claude now. Setup is still a little fiddly: you add it as a custom connector using a URL and client ID. I've put the instructions at ebbchart.com/connector.
You also need to enable it in EbbChart under Profile → Privacy → Connected AI assistants. It remains off until you do.
I'm working on making the connection simpler.
EbbChart is free on the App Store.