Patients change between appointments

Patients with fluctuating auditory conditions may experience meaningful hearing changes over days or weeks, yet formal audiometry is typically performed only occasionally.

As a result, deterioration, recovery patterns and treatment response may be incompletely captured in the clinical record. EbbChart is designed to preserve that timeline — allowing patient-generated longitudinal data to be reviewed alongside formal clinical assessment.

It is intended as observational support for clinical history, not as a diagnostic instrument.

Four data streams, continuously

Hearing thresholds

Apple Health audiogram sync, plus optional in-app pure-tone testing on supported consumer headphones (250 Hz–8 kHz). Home measurements are presented as longitudinal trends and are not a substitute for calibrated clinical audiometry.

Symptom logs

Vertigo, tinnitus, aural fullness, drop attacks, severity and duration — recorded close to the time of occurrence rather than reconstructed at the next appointment.

Medication timeline

Drug, dose, frequency and adherence captured over time and displayed alongside hearing trends, so treatment context is visible when reviewing trajectory.

Events and exposures

Flights, altitude stays, illness and other patient-logged events displayed on the hearing timeline to support temporal review.

A structured report, not a screenshot

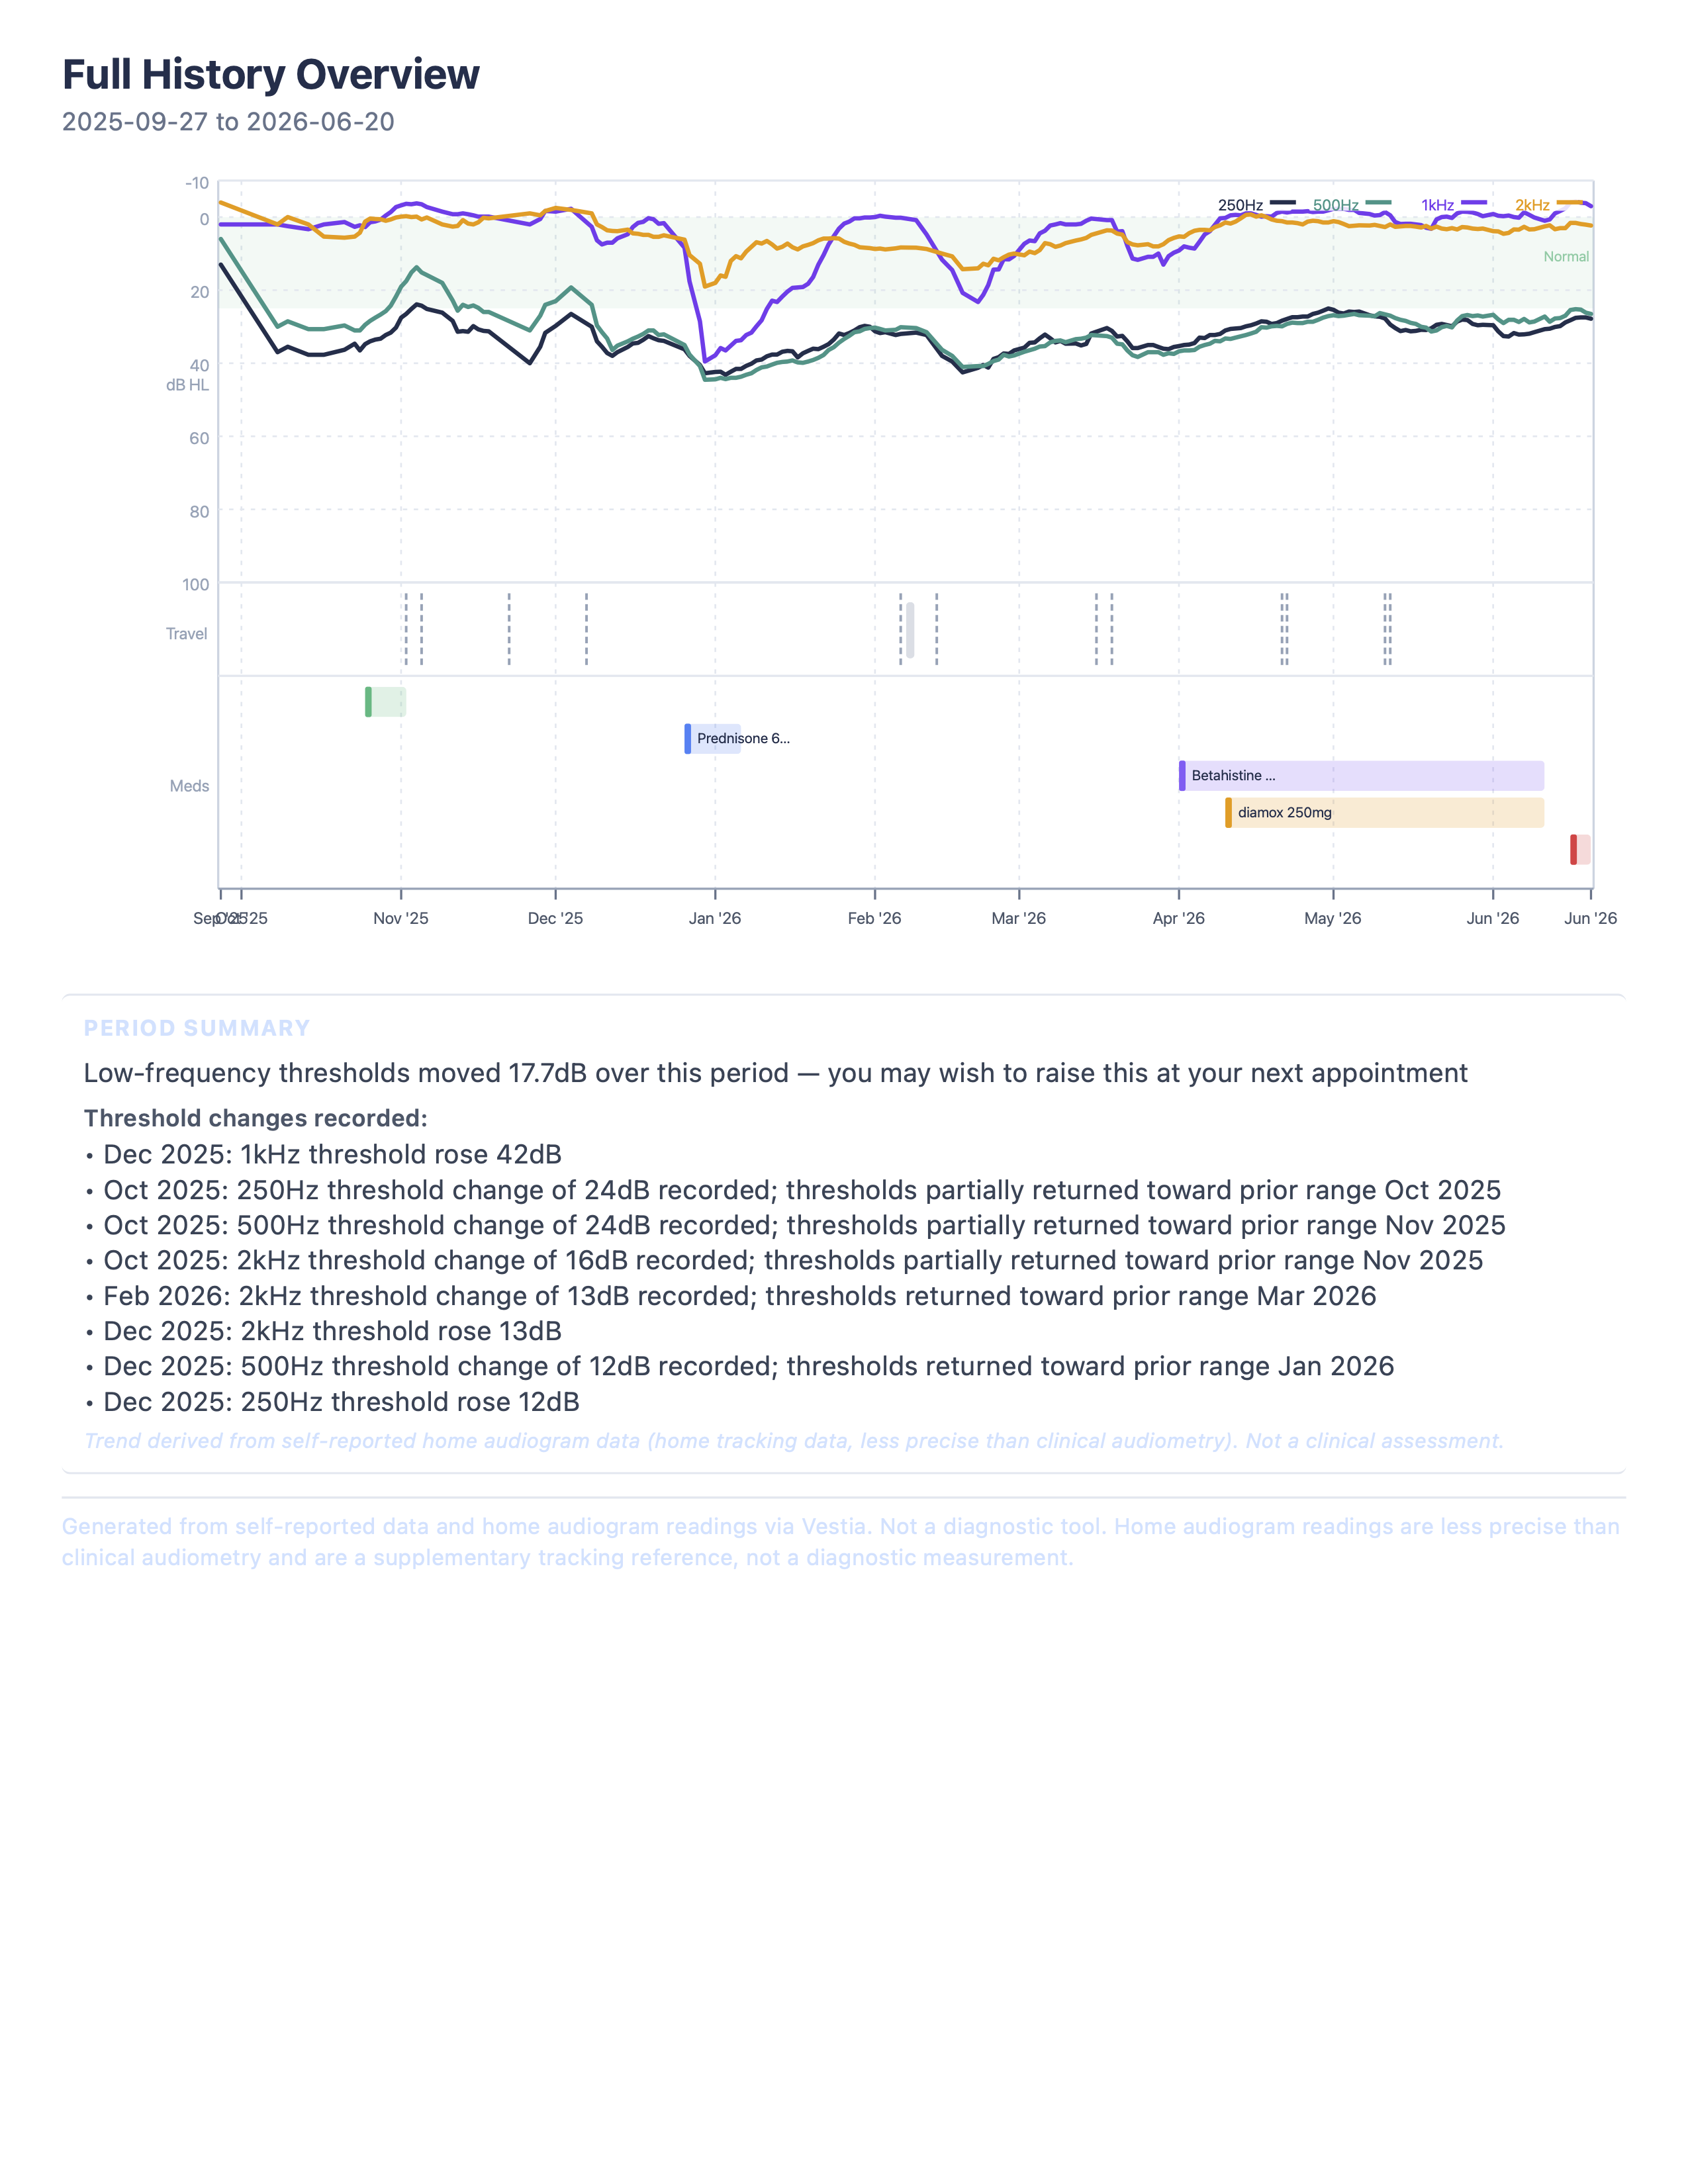
EbbChart generates a multi-page PDF the patient brings to consultations:

  • Longitudinal hearing trends across 1-month, 3-month, 6-month and full-history views
  • Medication timeline overlaid on the hearing chart
  • Threshold change events and return patterns
  • Period summary with trajectory classification
  • Patient symptom notes appendix

Formatted for review, not as a replacement for formal audiometry. Period-summary and event-level wording is observational — describing what the data shows to surface patterns for discussion, not to determine clinical significance.

Sample EbbChart ENT report — Full History Overview showing longitudinal audiogram chart with medication timeline

Seeking clinical collaboration

EbbChart is seeking clinical and academic input on the utility of longitudinal home hearing data in fluctuating auditory conditions — including test–retest reliability, comparison with calibrated audiometry, headphone and device variability, patient adherence, and whether longitudinal tracking improves clinical history between appointments.

Clinicians or researchers interested in reviewing the report format, advising on validation, or discussing observational study design are welcome to request a sample report or contact us directly.

Request a sample report

We'll reply personally with a sample PDF and any context you'd like.

Something went wrong — please try emailing us directly at hello@ebbchart.com
Thank you — we'll reply personally with a sample PDF and any context you'd like.

EbbChart is an observational tracking tool for patient-generated longitudinal hearing and symptom data. It is not a diagnostic device, does not replace calibrated clinical audiometry, and does not provide treatment guidance. Home audiogram measurements vary by device, headphones, environment and user behaviour (±5 dB). EbbChart reports should be treated as supplementary patient-generated context for clinical review.

Why EbbChart exists

EbbChart was built by David McAvinue, a patient with cochlear hydrops. After developing the condition and finding that hearing changes occurring between appointments were largely invisible to the healthcare system, David built a tool to track his own hearing fluctuations longitudinally.

EbbChart is available on iOS. The product is being developed in dialogue with the patient community and is seeking input from clinical specialists.

If you'd like to see the app, review the ENT report, or share feedback on clinical utility, please get in touch.

hello@ebbchart.com