When you start a new treatment for fluctuating hearing, two questions matter: when should I expect to see a response? And what actually happened to my hearing during that period?
They're difficult questions to answer from a before-and-after hearing test. Hearing thresholds may already be moving substantially from day to day, different frequencies can behave differently, and the appropriate time to assess a response depends on the intervention.
EbbChart's new Intervention Response feature is designed to put those measurements into context.
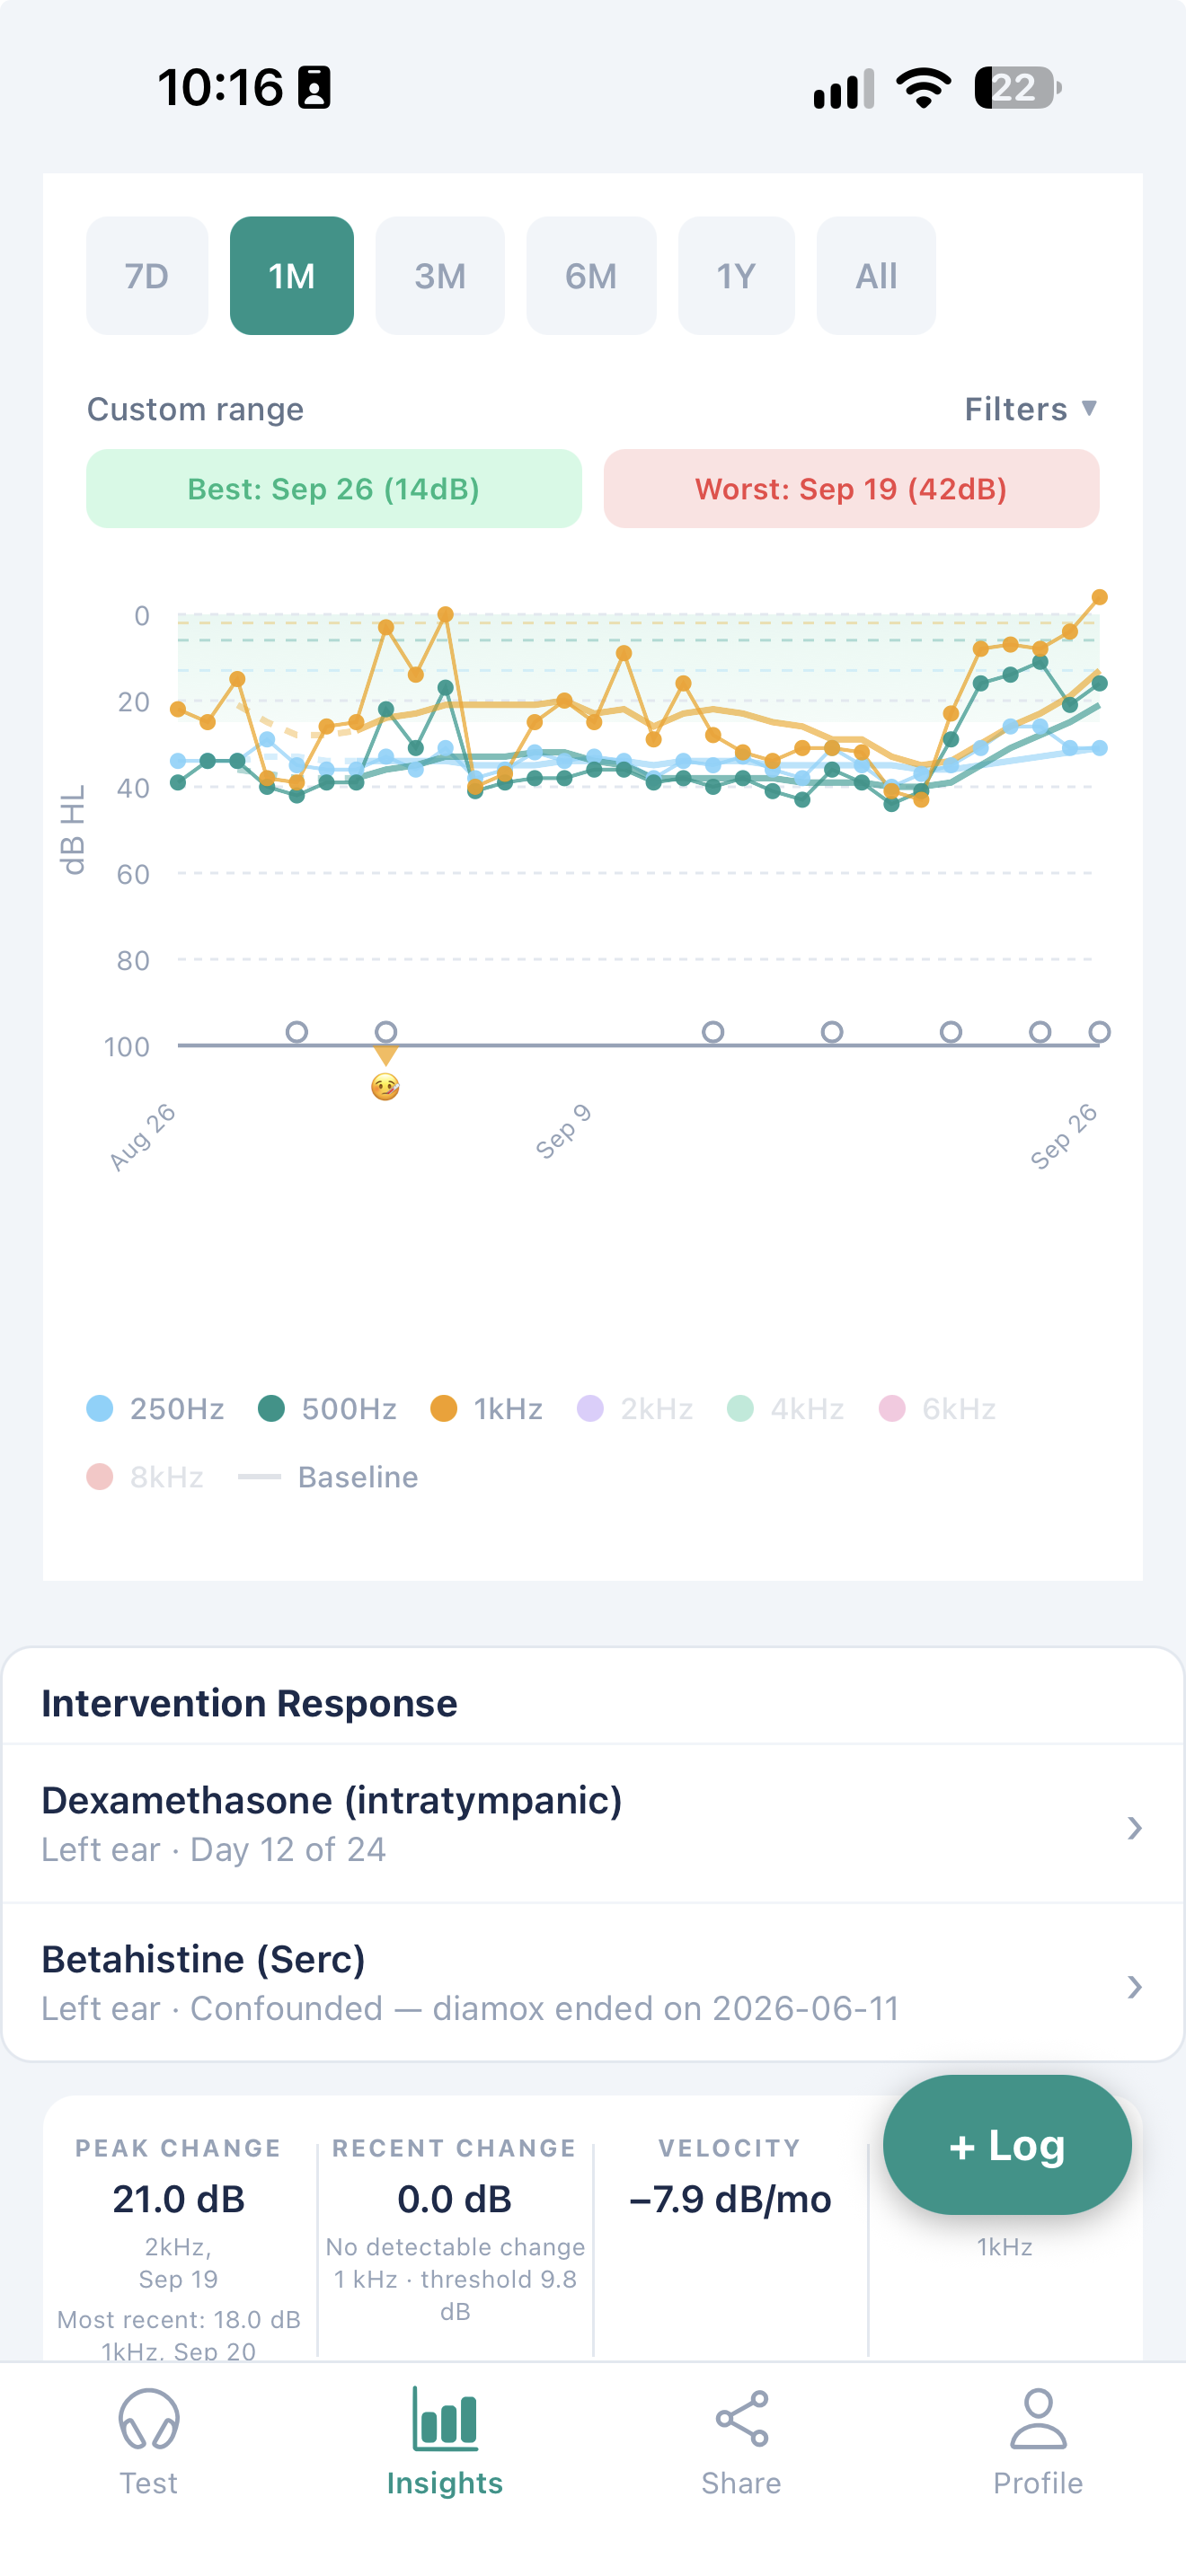
Your measurements against the evaluation timeline
Intervention Response doesn't simply put a marker on your hearing chart when treatment starts.
For supported intervention types, EbbChart uses published research and clinical guidance to establish the timeframe over which response is typically evaluated. Your own hearing measurements are then presented against that timeline.
Select an individual frequency — 250 Hz, 500 Hz, 1 kHz, 2 kHz and others where available — and see what happened to that frequency after the intervention.
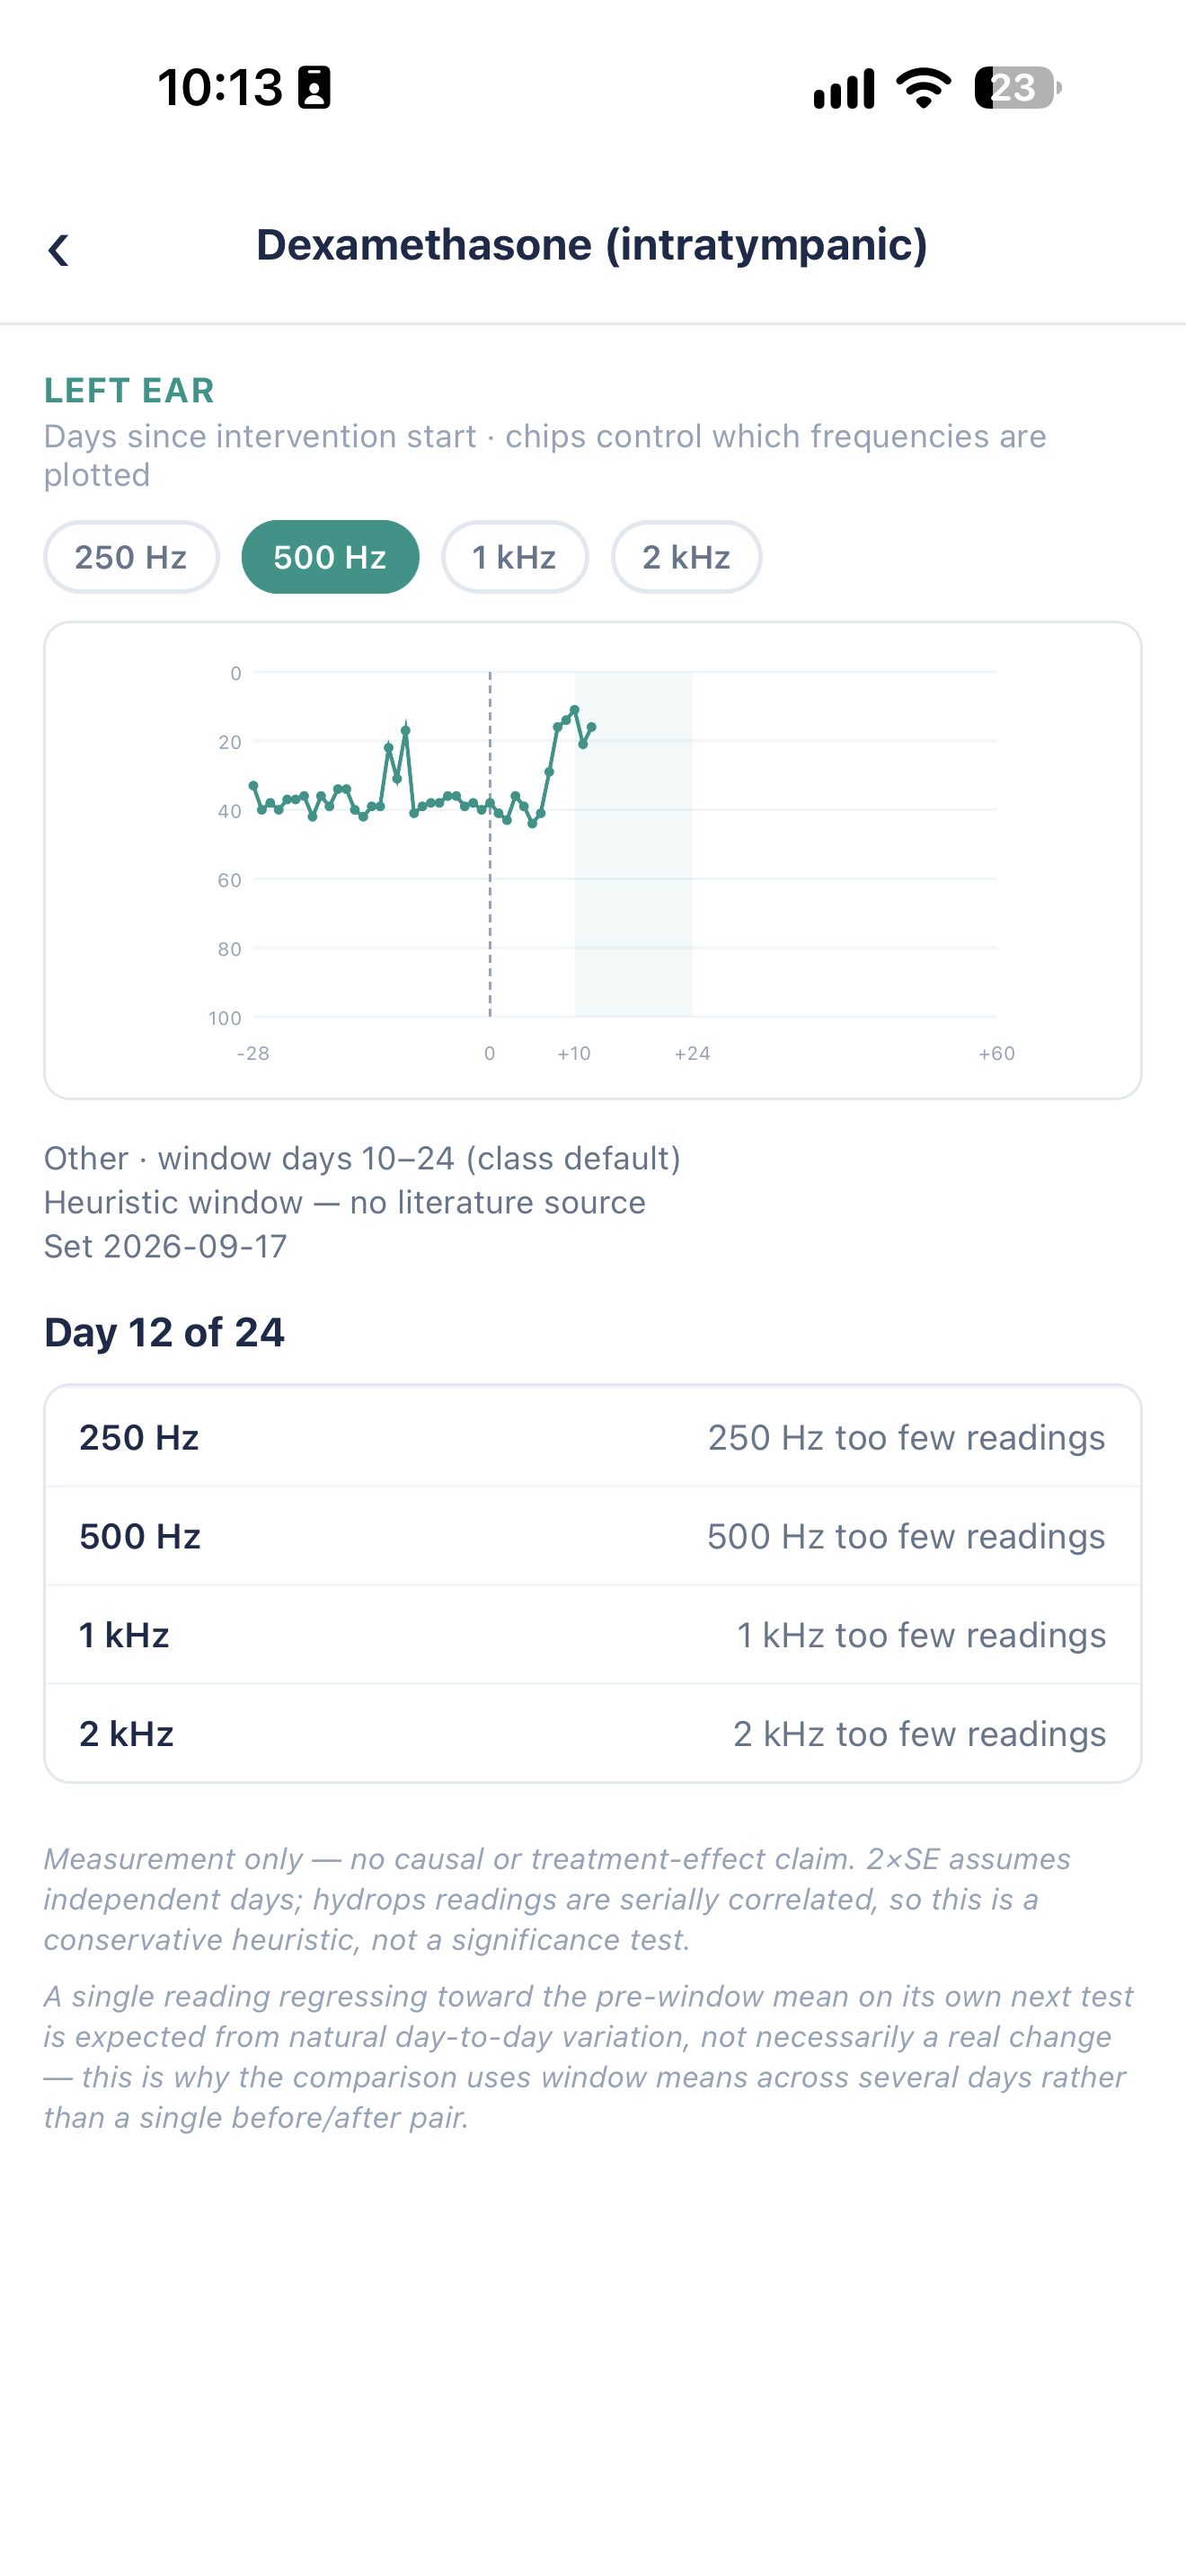
This matters because hearing doesn't necessarily move uniformly. 500 Hz might change while 1 kHz behaves differently. A single average can hide that.
As measurements accumulate, EbbChart can show the peak measured change, rate of change, variability, where you are within the evaluation window, and whether enough readings have been collected yet. If another intervention overlaps with the period being analysed, EbbChart can flag the analysis as confounded.
Research provides context, not certainty
Different interventions are evaluated over different periods. Where an appropriate evidence base is available, EbbChart uses published research or clinical guidance to define the typical evaluation window.
That doesn't mean EbbChart is predicting when an individual person should respond. The research provides context for interpreting the timeline, not a deadline for a treatment to work.
EbbChart distinguishes between evidence-based and heuristic windows, and the analysis window can be customised where appropriate. Intervention Response describes the measured hearing pattern around an intervention; it does not determine whether the intervention caused those changes.
How to use Intervention Response
There is no separate analysis to create. Intervention Response works from treatments recorded in EbbChart.
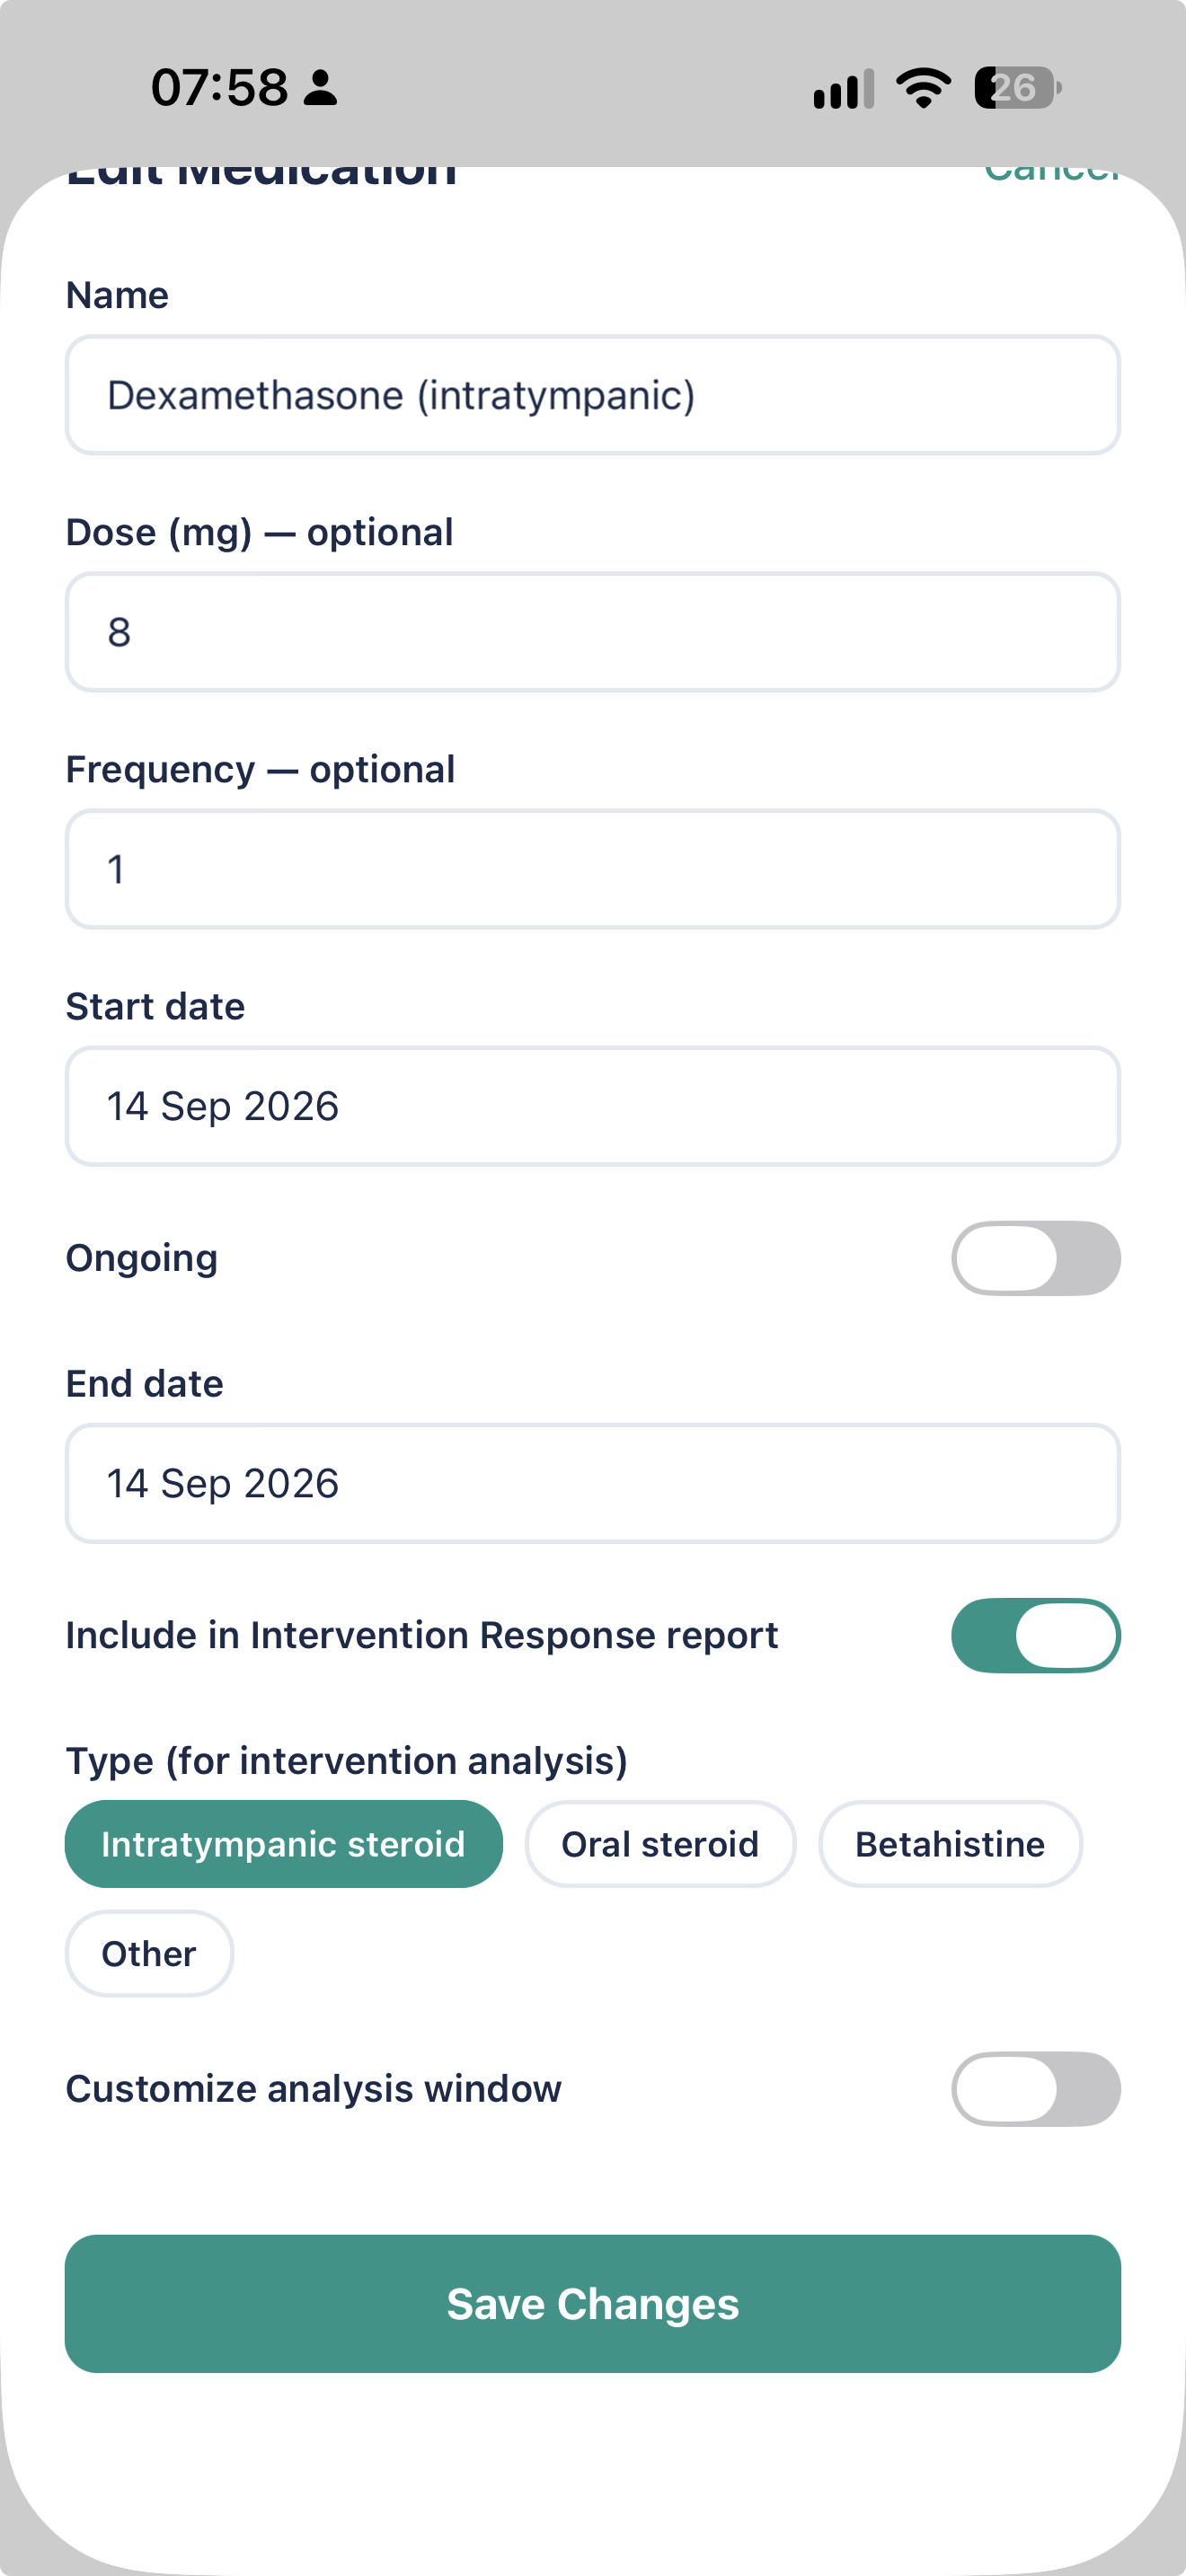
1. Add or edit a medication
Open the medication and enable Include in Intervention Response report.
2. Select the intervention type
Choose the appropriate type, such as Intratympanic steroid, Oral steroid or Betahistine. This allows EbbChart to apply the appropriate evaluation context where one is available.
3. Review the analysis window
EbbChart displays the configured evaluation period and its basis. You can customise the window if required.
4. Continue testing
Keep taking hearing tests as normal. As measurements accumulate, EbbChart builds the response timeline automatically.
5. Open Insights → Intervention Response
Select the intervention and the frequency you want to examine. The view updates as new measurements are recorded and remains available afterwards as part of your history.
One response record, wherever you need it
Intervention Response isn't confined to the Insights screen. The analysis is now incorporated into the EbbChart research report, so the intervention, evaluation window and frequency-by-frequency measurements can be preserved alongside the rest of your longitudinal hearing record.
The response remains available after the evaluation period ends. That means you can return to an earlier intervention later and see what happened — or compare it with another intervention in the future.
EbbChart's MCP layer has also been redesigned around the same structured Intervention Response data, making this perspective available for model-based analysis where access is enabled. Rather than giving a frontier model only a medication date and a collection of hearing tests, the intervention can be represented with its evaluation window and frequency-specific response data already structured.
That makes questions such as “What happened to my 500 Hz hearing during the evaluation window?”, “How did 1 kHz differ from 500 Hz?” and “How does this compare with a previous intervention?” much easier to explore.
Building a longitudinal treatment record
The aim is straightforward: make treatment history more useful than a list of medication names and dates.
For each intervention, EbbChart can preserve what was taken, when it was taken, when response would typically be evaluated, and what the measured hearing actually did during that period.
That record can be explored in EbbChart, incorporated into the research report, and made available as structured data for model-based analysis.
Intervention Response is available now in EbbChart.
Track the full picture
EbbChart is a free iOS app for tracking fluctuating hearing, including cochlear hydrops and Ménière's disease. EbbChart is a personal tracking tool and is not a medical device.
Download EbbChart →